Reading a confusion matrix for fit
Fit is usually evaluated as a three-way classification. The two mistakes it can make are not equivalent, and the standard summary treats them as though they were.
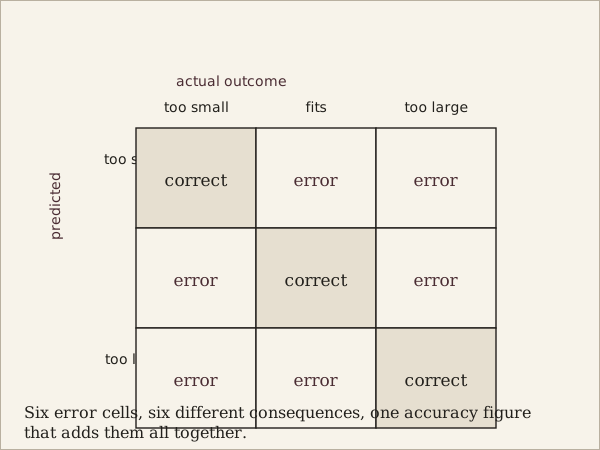
Reduce fit to a decision and you generally get three outcomes: the garment was too small, it fitted, or it was too large. Evaluating a system that predicts this is then a standard classification exercise, and the standard tool is a three-by-three table of predicted against actual. The table is more informative than any number derived from it, which is the argument of this piece.
What the cells mean
The diagonal holds the correct predictions. The off-diagonal cells hold the errors, and each one describes a different experience for the person on the other end.
- Predicted fits, actually too small. The garment cannot be worn. It will come back, and the recommendation was actively harmful.
- Predicted fits, actually too large. The garment can be worn but does not look as intended. It may be kept, which means the error is invisible in the return data.
- Predicted too small, actually fits. A garment the person could have worn was discouraged. This error leaves no trace anywhere.
- Predicted too large, actually fits. The same silent loss in the other direction.
- The two remaining cells are confusions between the two failure directions, which usually indicate a systematic offset rather than noise.
Why one number is not enough
Overall accuracy adds all six error cells together and divides. It therefore asserts that predicting a fit for a garment that will not close is equivalent to declining to recommend a garment that would have been fine. Nobody who has thought about it for a minute believes that, and yet accuracy is what gets reported.
The imbalance in the underlying data makes it worse. In most collected fit data the fits outcome is much more common than either failure, because people generally order the size they have learned to order. A system that predicts fits every single time will therefore score well on accuracy while being worthless, since it has learned the base rate and nothing else.
A system that predicts fits every single time scores well on accuracy and has learned nothing but the base rate.
Reading the table properly
Report the matrix. Then, from it, report per-class recall: of the garments that were genuinely too small, what fraction did the system catch. That is the number that describes whether the system protects anyone from the outcome that actually costs them something.
Look for asymmetry along the diagonal. A model that misses small failures more often than large ones has an offset, probably inherited from advice in the training data that leaned towards the safer larger size. That is a correctable bias and it is completely invisible in an accuracy figure.
Break the table down by garment category and by body dimension. A single matrix over a whole catalogue averages a shirt with a coat and a tailored range with a relaxed one. The per-segment tables are where the real weaknesses live, and they are usually concentrated in the segments with the fewest examples.
The label problem underneath
One caution about the ground truth itself. The actual outcome is usually derived from whether the garment was returned and what reason was given, and that is a noisy proxy. A garment kept out of inconvenience is recorded as a fit. A garment returned for reasons of taste may be recorded as a fit failure if the return form offered no better option.
Which means the matrix is a table of agreement with a noisy label, not a table of truth. It is still the most useful summary available, and it is a good deal more honest than the single number usually printed in its place.