The long history of the size chart
Every automated sizing system inherits a set of numbers that were assembled long before anyone thought to compute with them. The inheritance shows.
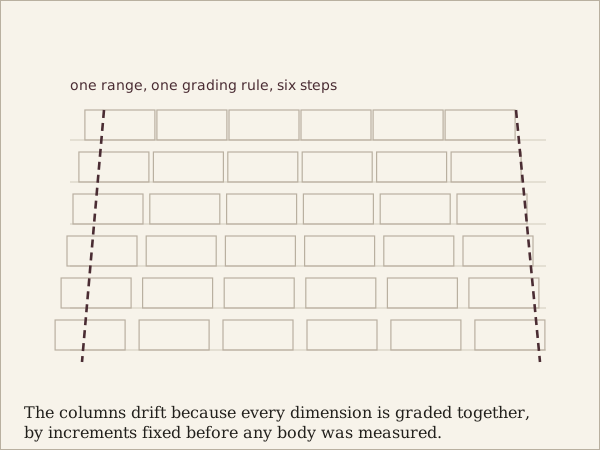
A size chart looks like data. It has rows, columns and numbers, and it can be read into a table without complaint. What it is, historically, is a manufacturing convention: a compromise between the variety of human bodies and the economics of cutting many identical garments from the same pattern. Understanding where the convention came from explains a great deal about why systems built on top of it behave strangely.
From measured to graded
Before ready-to-wear, a garment was cut for a person. The tailor took the measurements that the particular garment required and drafted from them. There was no size, because there was no need for one; the pattern was the size.
Mass production required something else: a small number of patterns that would serve a large number of bodies. That meant choosing a base pattern and then grading it, expanding and contracting it by fixed increments to produce a range. Grading is a craft with its own rules, and the crucial fact about it is that it applies a single set of increments to every dimension at once. Move up one size and the chest, the waist, the shoulder, the sleeve and the armhole all change together, by amounts fixed in advance.
This is a reasonable engineering compromise and it has a clear consequence. The range serves bodies that vary in the same proportions the grading assumes. A body that is wide in the chest and narrow in the shoulder is not one size or another; it is between the pattern's assumptions, and no size in the range was drafted for it.
The number that means nothing in particular
The label on the garment is a further step removed. Size labels are not measurements and never were. They are names for positions in a grading sequence, and the mapping from name to dimension is set by whoever produces the range. Two garments labelled the same can be cut to different measurements, and the same garment can carry different labels in different markets. There is no unit.
Size labels are names for positions in a sequence. There is no unit.
For a system trying to reason across many ranges, this is the central difficulty. The label is a categorical value with no meaning outside its own range, and treating it as ordinal, or worse as numeric, imports the assumption that the sequences line up. They do not, and the failure is not random: it is systematic per producer, which means a model can learn a compensation for a range it has seen a great deal of and be badly wrong on one it has not.
Ease, the missing column
There is one more inherited quantity that charts almost never publish. A garment is not cut to body measurements; it is cut to body measurements plus ease, the deliberate extra room that lets a person move, breathe and get dressed. Ease varies by garment type, by intended fit, and by the cut the pattern is aiming at. A tailored shirt and a relaxed shirt drafted for the same chest are different garments and both are correct.
Because ease is a design decision rather than a measurement, it rarely appears in a chart. A body-measurement chart and a garment-measurement chart therefore describe different things, and a system that mixes them, or that does not know which kind it has been given, will produce recommendations that are consistently and invisibly off by the amount of ease the designer intended.
Reading the inheritance honestly
The practical conclusion is not that size charts should be discarded. They are the accumulated record of how clothes are actually made, and no system that ignores them will produce a wearable recommendation. The conclusion is that they should be read as what they are: a manufacturing convention, per producer, with an implicit and usually unstated design intent, describing either a body or a garment but not saying which.
A pipeline that records those distinctions explicitly, which chart it holds, whose grading it belongs to, whether ease is included, will make fewer confident mistakes than one that reads the numbers off the page and starts computing.